Getting Started with BizTalk Server 2013 R2’s Built-in Health Monitoring

By Nick Hauenstein

This is the second in a series of posts exploring What’s New in BizTalk Server 2013 R2.

With the BizTalk Server 2013 R2 release, Microsoft has finally implemented a common request to have some level of built-in monitoring tool for a BizTalk Server installation. While this built-in option won’t replace things like the BizTalk Server 2013 Monitoring Management Pack for System Center Operations Manager, or come remotely close to the feature set of third party options like BizTalk360 or AIMS for BizTalk, but it does provide an out-of-the-box solution for performance monitoring, environment validation and notifications.

Ultimately, this tool was built by the same project team that created the MsgBoxViewer tool (MBV), and represents an effort to more tightly integrate this stand-alone tool with the BizTalk Server Administration Console.

The first release supports the following features, with updates promised in the future:

  • Ability to monitor multiple BizTalk Server environments
  • MBV report generation and viewing
  • Dashboard view for overall BizTalk Server environments health
  • Scheduled report collection
  • Email notifications
  • Performance monitor integration with pre-loaded scenario-based performance counters
  • Report management

I Have BizTalk Server 2013 R2, But Where Is This Health Monitor?

Unfortunately, the Health Monitor is not registered for use by default, and doesn’t show up anywhere by default. Before making use of it, you’ll have to do some dirty work to get it prepared for use. The core files live under the BizTalk Server installation directory at SDKUtilitiesSupport ToolsBizTalkHealthMonitor.
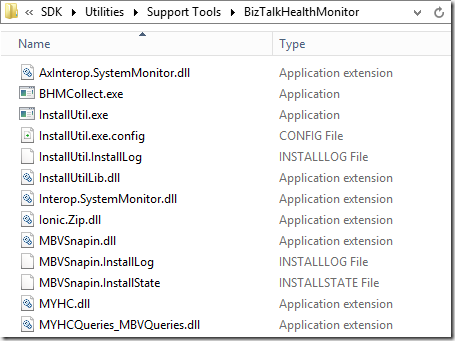
BizTalk Server 2013 R2 Health Monitor Files

So what do we do here? We need to run InstallUtil.exe against the MBVSnapin.dll. In order to accomplish this, we can either drop to the command line, or drag and drop MBVSnapin.dll on InstallUtil.exe.

Register BizTalk Server 2013 R2 Health Monitor

Once it is registered, you can add it to a Management Console alongside the BizTalk Server Administration Console for an all-up management experience.

In order to do that, run mmc /32

Running MMC /32

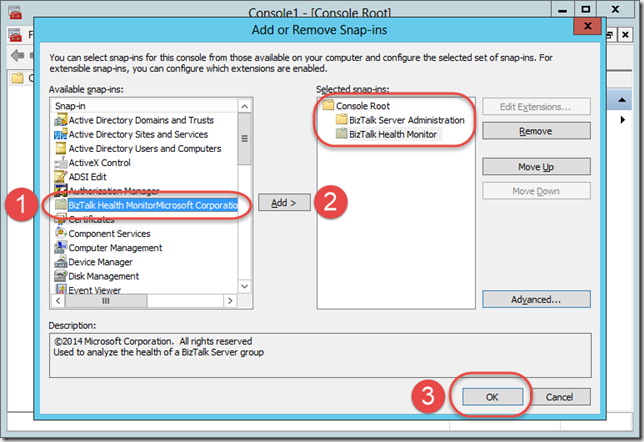
After a nice clean and empty management console appears, press CTRL+M, and then add both the BizTalk Health Monitor and the Microsoft BizTalk Server Administration snap-ins to the console.

Adding BizTalk Server 2013 R2 Health Monitor to the Console

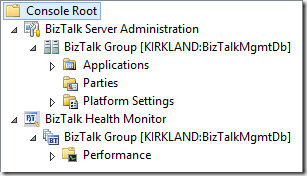
You end up with an Administration Console window containing the items shown in the screenshot below. This might be a good opportunity to add the Event Viewer snap-in for each of your runtime servers as well. At this point, you may want to save the console setup for later use.

BizTalk Server 2013 R2 Administration Console with Health Monitor

What Can I Do with This Thing?

If you expand the Performance node, and click Current Activity, you will be able to examine select performance counters across your BizTalk Server installations through an embedded perfmon display.

image

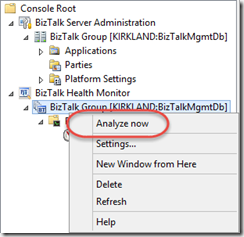
If you right-click each BizTalk Group within the Health Monitor, you have the ability to execute a set of rules that validate your installation while highlighting problem areas.

Running Analysis

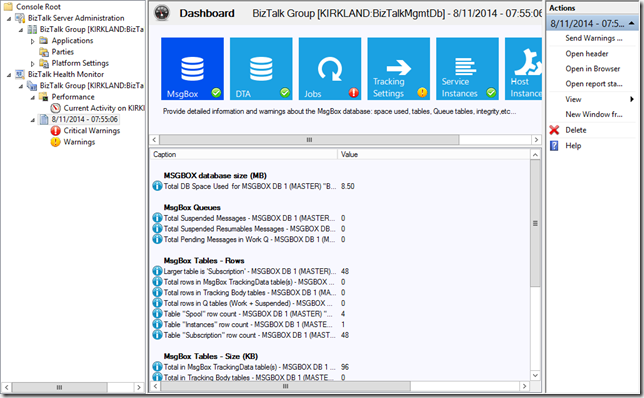
Once you run the analysis, a node is added to the navigation pane labeled with the date and time of the analysis. This report contains the result of executing validation rules at a fixed point in time. This report can be sent via email, or opened in the browser for additional details.

Results of Analysis

Right now, it’s looking like my installation is throwing a pretty critical warning when it comes to the Jobs category. Let’s see what that might be.

Jobs Warning

It looks like the Backup BizTalk Server job hasn’t been enabled, and there isn’t any history indicating that this job has ever executed. That’s fairly concerning and problematic. It would be nice if we could have been notified about that in a more proactive manner.

Enabling Automatic Scans / Notifications

If I go back to the BizTalk Group within the Health Monitor, and click Settings, I will find myself at a screen that enables me to configure automatic analysis of my BizTalk Server Group as well as notifications of scan results.

BizTalk Health Monitor Settings Menu

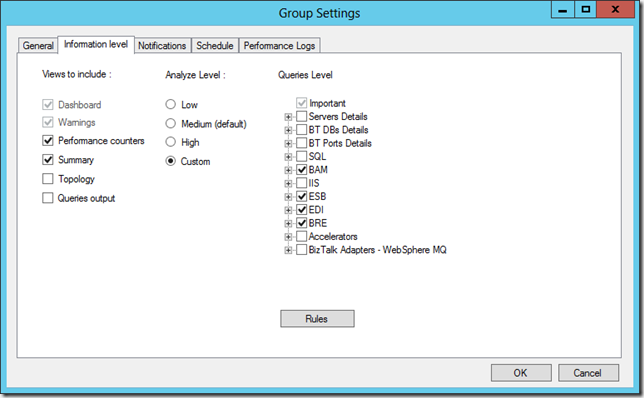
Additionally, I can even configure the queries executed, rules evaluated, and the views on top of that information I want to include in each analysis.

Configuring Reporting Settings

If I want to enable notifications, I have a few different options. I can either configure email notifications, or if I want to essentially pipe these notifications into another tool that can consume event log entries, I can direct notifications to the event log instead.

Notification Settings

More to Come

As mentioned earlier, it sounds like the team is already well underway with an update to this tool, and it’s safe to say that there will likely be more to come. I would venture to guess that this will mean either more features and deeper console integration (since there are still quite a few times where clicking an option launches the browser to show full details). We’ll keep this space updated.

In the meantime, if you’re just now moving to either BizTalk Server 2013, or BizTalk Server 2013 R2, and you want to keep your skills up to date, check out one of our BizTalk 2013 Developer Immersion classes or BizTalk 2013 Administrator Immersion classes. Just this last week, students in the developer class that I taught were able to see this functionality demonstrated live.

If you’re already a QuickLearn student, keep following the blog to get the latest bleeding edge information as it becomes available. The series will continue next week!

What’s New In BizTalk Server 2013 R2

By Nick Hauenstein

This is the first in a series of posts exploring What’s New in BizTalk Server 2013 R2. It will also serve as the index of the series, and contain links to all of the posts to come.


This is a listing of all of the posts within the series:

  1. What’s New In BizTalk Server 2013 R2
    Shows Shared Access Signature (SAS) Authentication for Service Bus
  2. Getting Started with BizTalk Server 2013 R2’s Built-in Health Monitoring
    Demonstrates the installation and use of the BizTalk Health Monitor
  3. JSON Schemas in BizTalk Server 2013 R2 [Code Sample]
    Shows how to generate a JSON schema and write unit tests to validate instances
  4. Decoding JSON Data Using the BizTalk Server 2013 R2 JsonDecode Pipeline Component [Code Sample]
    Shows how to receive JSON messages and write integration tests to validate a configurable pipeline

We’ve been pretty busy over here at QuickLearn over the past few months, as many of you may have noticed. We’ve released our BizTalk Server 2013 Administrator Deep Dive class, and have been hard at work on our Azure BizTalk Services Fundamentals class (coming as soon as September 2014). Meanwhile, Microsoft has released BizTalk Server 2013 R2.

As a result, I am starting a series in a similar vein as my What’s New in BizTalk Server 2013 series, to uncover those new features in 2013 R2 that will make your life just a little bit easier. However, this time around it will be a weekly series that will occasionally take breaks to share time with posts about Azure BizTalk Services.

All of that having been said, I’m going to get upgraded, and then jump right in to check out one of the things I’m most excited about.

image

I Love Microsoft Azure Service Bus

I’ve got to admit that I’m a huge fan of Microsoft Azure Service Bus. Not only that, but I’m a big fan of the .NET API which really feels oh-so-right and makes allowances for multiple patterns for synchronous vs. asynchronous code.

That being said, a big pain point with Service Bus has been using the Access Control Service for fine-grained security – which really can be the opposite of intuitive – especially when the concept of an identified user isn’t really needed or important to your integration scenario.

Thankfully, ACS isn’t the only security model that Service Bus supports. We actually can also use Shared Access Signatures for authentication. SAS authentication allows you to generate a key for a specific fine-grained entity within Service Bus for which you want to authorize access (e.g., Listen access for a given Queue), and then from that key you can generate a signed token that expires after a period of time. This token need not be borne by a specific user, it need only be presented to be accepted.

While all of that could be filed under mildly interesting, the important thing to note is that unless you have BizTalk Server 2013 R2 installed, you will be limited to using the ACS model for Service Bus authentication and authorization.

SAS-SY SB-Messaging Adapter

Thankfully, after upgrading to BizTalk Server 2013 R2, if you visit the Authentication tab of the SB-Messaging Transport Properties dialog, you will find the following option available:

image

Knowing that you can use Shared Access Signatures is one thing, being able to put that into practice is another. If you haven’t used SAS authentication/authorization before, you’re in for a treat.

Configuring SAS Authentication for Service Bus Entities

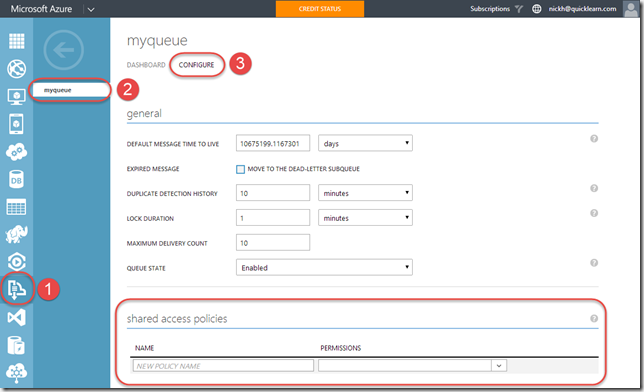
If you head over to the Microsoft Azure Management Portal, create some Service Bus entities, and then head to the Configure tab for the same, you will find a section titled Shared Access Policies

image

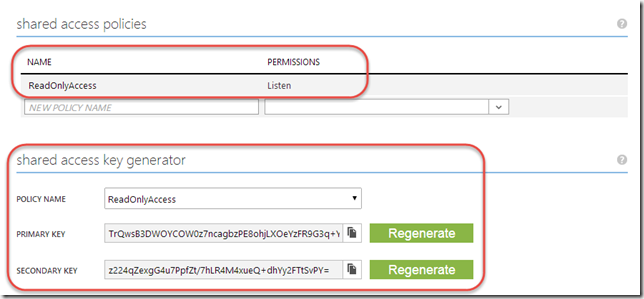
This section allows you to define access policies (e.g., read-only access, or Listen permission for the queue shown in the screenshot), and then generate signing keys that can be used to generate access tokens granting that level of permission.

image

It’s nice to know that this can all be done through the web UI if needed, but nothing here seems to relate back to the first property that you may have noticed when examining the settings for the SB-Messaging adapter (i.e., the Shared Access Key Name property). In reality, it’s asking for what the UI calls the Policy Name.

So what would the adapter configuration look like for this Shared Access Policy?

image

Putting it to the Test

So let’s put the updated adapter to the test and see what we get out the other end. First, let’s whip up a quick console app that will give us a message that is simply the string “Hello World”

image

Yes, the purists will note that I did not use a MesagingFactory. Why? Because this is not going to be a long-lived client, and it felt nicer to type. However, given a real world example, MessagingFactory will usually be the correct choice.

So let’s run down what I have while that message sits in the queue. I have a one-way Receive Port with a single Receive Location. This Receive Location uses the SB-Messaging adapter pointed at myqueue and using SAS for authentication (per the settings in the screenshot above). I have a Send Port subscribing to all messages from this Receive Port. This Send Port is using the FILE adapter, because I’m writing this late at night and am running out of creativity.

With everything in place, you will see this glorious sight…

image

And opening the file reveals…

image

Am I impressed that this traveled through a Service Bus Queue to arrive on my file system? No. I’m just happy that it authenticated using SAS token along the way, and I didn’t have to touch ACS at all during the process.

One hope that I have for this new functionality, is that it will see people moving beyond using owner for everything. Even though it’s something that I would find myself doing for demonstration purposes, it is also something that made me cringe to see in real life. It’s a lazy and even dangerous thing to do in some cases.

Just a Taste

This is really just a small flavor of what’s to come. There are some pretty big changes that aren’t getting a lot of fanfare at the moment, but I hope that will change as more and more people upgrade and discover what is waiting for them under the covers.

Until next week, take care!